Demystify College Algebra with Step-by-Step Examples and Expert Guidance
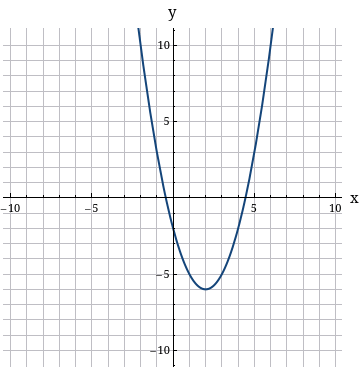
Write an equation for the graphed function by using transformations of the graphs of one of the toolkit functions.
y =

Write an equation for the graphed function by using transformations of the graphs of one of the toolkit functions.
y =

The determined Wile E. Coyote is out once more to try to capture the elusive roadrunner. The coyote wears a new pair of power roller skates, which provide a constant horizontal acceleration of 15 m/s2, as shown in Figure P3.73. The coyote starts off at rest 70 m from the edge of a cliff at the instant the roadrunner zips by in the direction of the cliff. (a) If the roadrunner moves with constant speed, find the minimum speed the roadrunner must have to reach the cliff before the coyote. (b) If the cliff is 100 m above the base of a canyon, find where the coyote lands in the canyon. (Assume his skates are still in operation when he is in “flight” and that his horizontal component of acceleration remains constant at 15 m/s2.)
The function g is related to one of the parent functions
g(x) = x^2 + 6
The parent function f is:
f(x)= x^2
Use function notation to write g in terms of f.
Find the discriminant b2−4acb2-4ac, and use it to determine the number of real solutions to the equation.
a2+8=4aa2+8=4a
Discriminant:
Real Solution:
A batter hits a pitched ball when the center of the ball is 1.22 m above the ground. The ball leaves the bat at an angle of
a) Does the ball clear a 7.32-m-high fence that is 97.5 m horizontally from the launch point?
b) At the fence, what is the distance between the fence top and the ball center?
a) Does the ball clear a 7.32-m-high fence that is 97.5 m horizontally from the launch point?
b) At the fence, what is the distance between the fence top and the ball center?
Suppose
1. Find the local maxima of
2. Find the local minima of
3. Find the saddle points of
1. Find the local maxima of
2. Find the local minima of
3. Find the saddle points of
For the following exercises, enter the data from each table into a graphing calculator and graph the resulting scatter plots. Determine whether the data from the table could represent a function that is linear, exponential, or logarithmic.
For the following exercises, enter the data from each table into a graphing calculator and graph the resulting scatter plots. Determine whether the data from the table could represent a function that is linear, exponential, or logarithmic.
Starting from the point
Given that f(x) = 3x - 7 and that (f + g)(x) = 7x + 3, find g(x).
g is related to one of the parent functions. Describe the sequence of transformations from f to g.
g is related to one of the parent functions. Describe the sequence of transformations from f to g.
use long division to determine if 2x-1 is a factor of
For the following exercises, enter the data from each table into a graphing calculator and graph the resulting scatter plots. Determine whether the data from the table could represent a function that is linear, exponential, or logarithmic.
For the following exercises, enter the data from each table into a graphing calculator and graph the resulting scatter plots. Determine whether the data from the table could represent a function that is linear, exponential, or logarithmic.
Graph f and g in the same rectangular coordinate system. Use transformations of the graph off to obtain the graph of g. Graph and give equations of all asymptotes. Use the graphs to determine each function’s domain and range.
For the following exercises, enter the data from each table into a graphing calculator and graph the resulting scatter plots. Determine whether the data from the table could represent a function that is linear, exponential, or logarithmic.
For the following exercises, enter the data from each table into a graphing calculator and graph the resulting scatter plots. Determine whether the data from the table could represent a function that is linear, exponential, or logarithmic.
Show that f is inverse of g and vice-versa, if
f(x)=x-6 and g(x)=x+6
f(x)=x-6 and g(x)=x+6

 Please answer with solution.